Introduction
Kafka metrics can be collected and displayed using different methods.
Prometheus
Prometheus can be used to collect monitoring data from Kafka.
To enable this you need to update your cluster configuration to include a metricsConfig section for both the cluster and zookeeper.
    kafka:
      authorization:
        type: simple
        superUsers:
          - CN=kowl
          - CN=connect
...
     metricsConfig:
        type: jmxPrometheusExporter
        valueFrom:
          configMapKeyRef:
            name: kafka-metrics
            key: kafka-metrics-config.yml
...
    zookeeper:
      replicas: 1
      storage:
        deleteClaim: false
        size: 10Mi
        type: persistent-claim
      metricsConfig:
        type: jmxPrometheusExporter
        valueFrom:
          configMapKeyRef:
            name: kafka-metrics
            key: zookeeper-metrics-config.yml
This is the kafka-metrics.yaml for creating the config map: kafka-metrics.yaml
Then add kafka exporter component.
    kafkaExporter:
      groupRegex: ".*"
      topicRegex: ".*"
      logging: debug
      enableSaramaLogging: true
      readinessProbe:
        initialDelaySeconds: 15
        timeoutSeconds: 5
      livenessProbe:
        initialDelaySeconds: 15
        timeoutSeconds: 5
When you start your cluster you should see an additional pod running for Kafka exporter.
You can create a service for this using this yaml file: kafka-exporter.yaml
Using minikube tunnel you can view the metrics using this link: localhost:9100/metrics
Next edit the scrape configs section in prometheus.yaml to include an entry for these metrics.
    scrape_configs:
    - job_name: prometheus
      static_configs:
      - targets:
        - localhost:9090
    - job_name: kafka-exporter
      scrape_interval: 10s
      metrics_path: /metrics
      static_configs:
      - targets:
        - kafka-exporter.kafka:9100
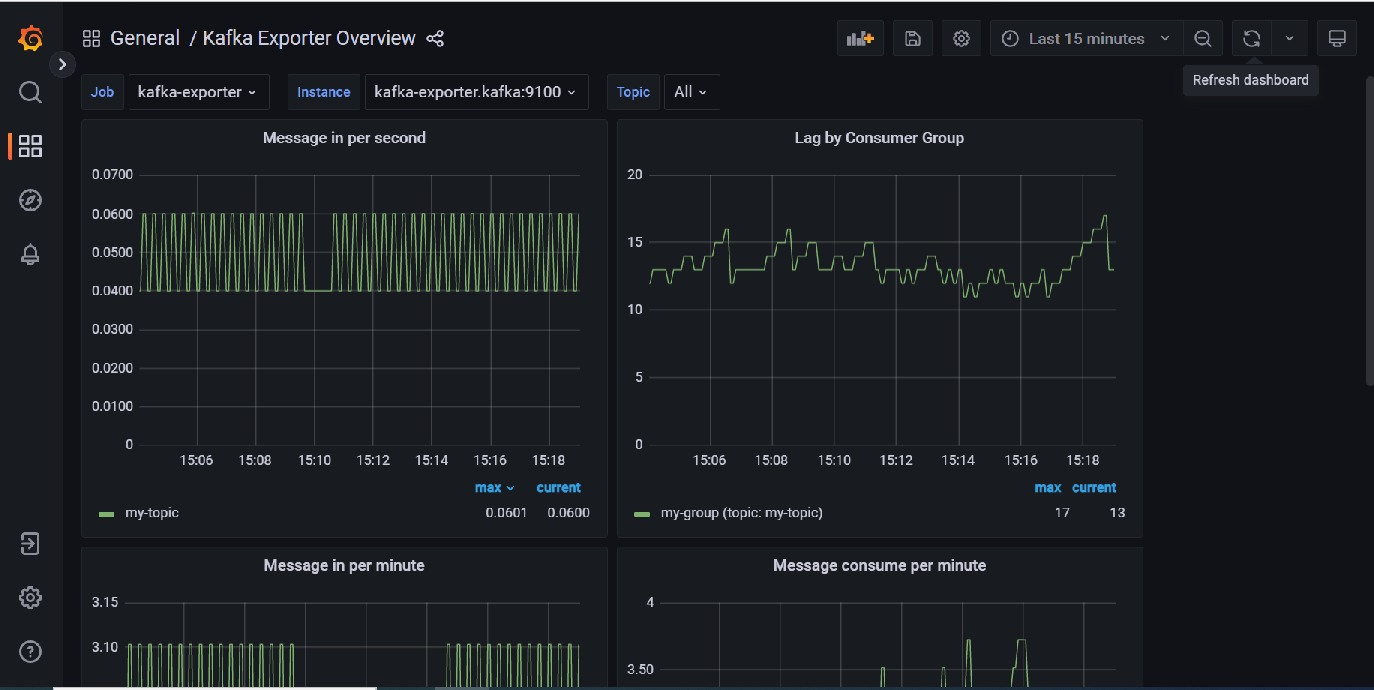
Grafana
You can then setup the grafana dashboard to view your metrics : kafka-exporter-overview_rev5.json
These metrics can also be imported into telegraf by adding the following lines to your inputs:
     [[inputs.prometheus]]
      urls = ["http://kafka-exporter.kafka:9100/metrics"]
      response_timeout = "10s"
You can also include metrics from your Kafka bridge by adding the following line to the bridge spec: enableMetrics: true
Note: It is also possible to obtain JMX metrics using jolokia (GitHub - paksu/kafka-jolokia-telegraf-collector: Simple Kafka broker JMX metric collection with Telegraf) but this requires creating a custom a custom kafka cluster image if you are using Strimzi.
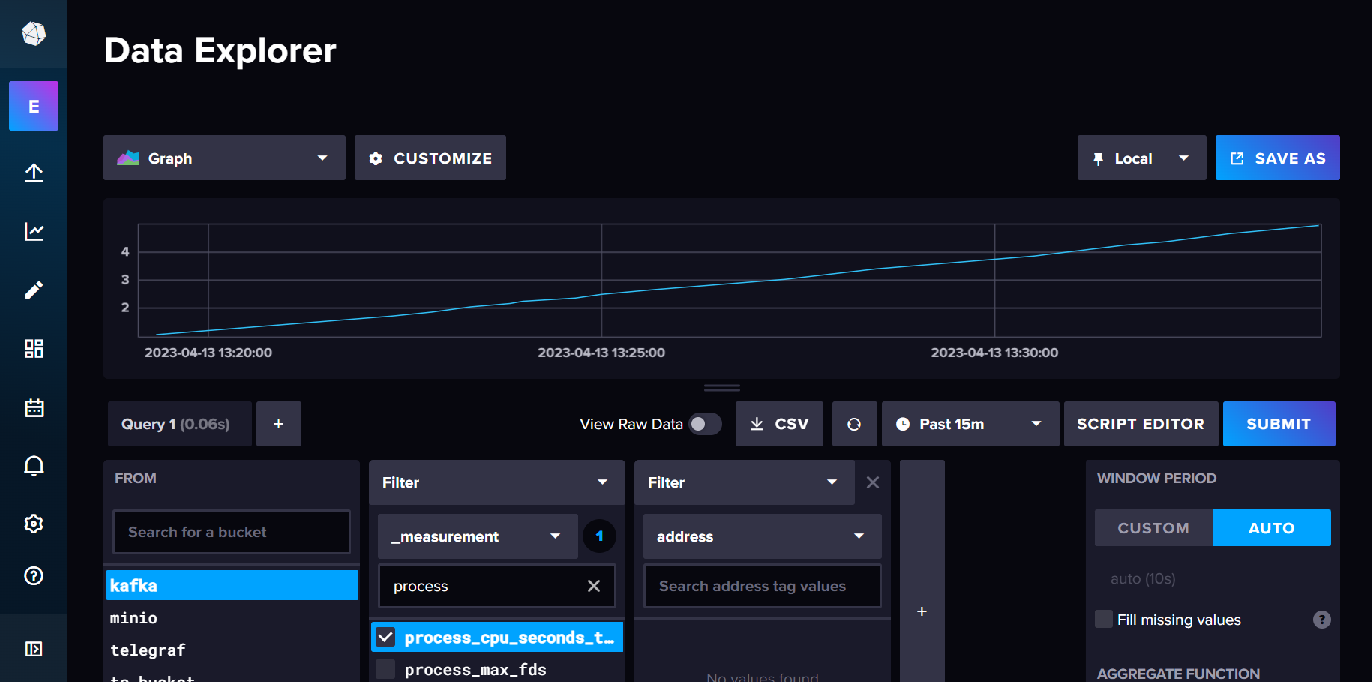
InfluxDB
To store these metrics in InfluxDB you need to do is setup up a bucket and a metrics scraper for the kafka-exporter metrics endpoint.
You can then view the metrics in data explorer.
Links
Grafana Dashboard for Kafka Exporter