...
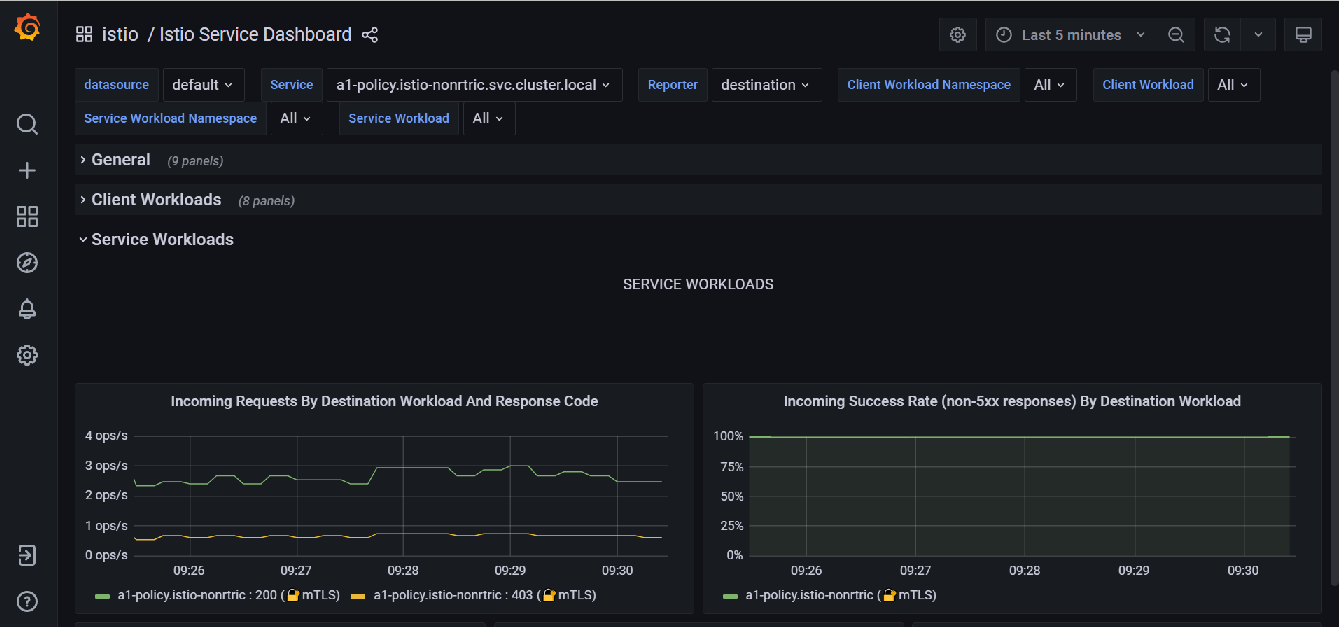
Select the Istio Service dashboard → service workloads to see the incoming requests
You can elasticsearch as a datasource to grafana.
Add the URL for your elasticsearch instance.
Set basic auth to on.
Add your elasticsearch username and password.
Add your index name (e.g. logstash-*)
Set the version to 7.10+
Set Max concurrent shard requests to 1
Save and test.
You datasource is now setup.
To view the data being collected download and grafana elasticseach dashboard and import it.
This does not really work for a single shard instance like the one we are using.
Prometheus
Start the prometheus dashboard by running: istioctl dashboard prometheus
See the following link on Querying Metrics from Prometheus for more information.
You can setup your own dashboard in grafana to view these metrics if the default dashboards don't meet your needs.
You can also insert your own customer metrics into your code.
OAuth2 Proxy
Welcome to OAuth2 Proxy | OAuth2 Proxy (oauth2-proxy.github.io)
...