...
token = { "isValid": isValid, "payload": payload } {
authorization_header := input.attributes.request.http.headers.authorization
encoded_token := trim_prefix(authorization_header, "Bearer ")
payload := io.jwt.decode(encoded_token)[1]
isValid := true
}
OPA with prometheus and grafana
Add the following job to your prometheus.yaml file in the scrape_configs section:
- job_name: opa
scrape_interval: 10s
metrics_path: /metrics
static_configs:
- targets:
- opa.default:8181
This will ebable metric collection from the opa /metrics endpoint:
The full ist is available here: Open Policy Agent Monitoring
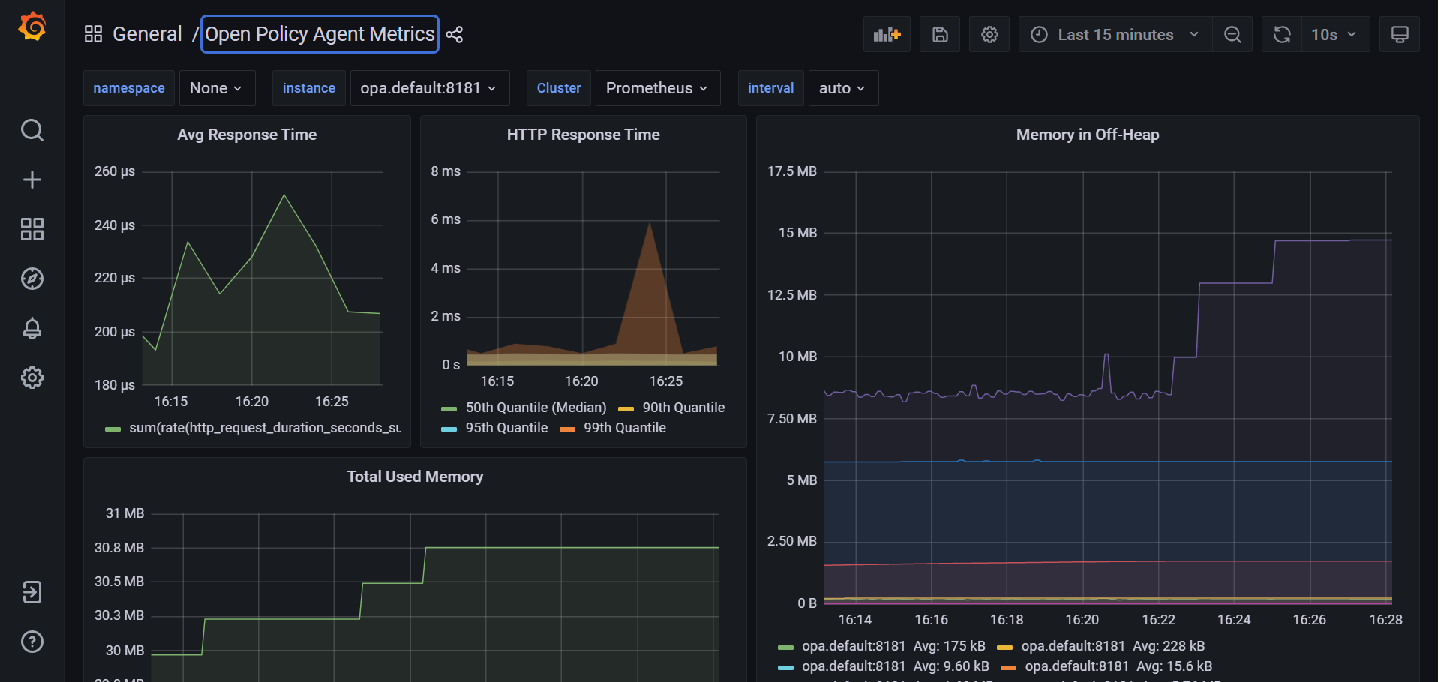
Download the Open Policy Agent metrics Dashboard from grafana and import it into your grafance instance
In the instance drpdwon type opa.default:8181 (assuming opa is running in the default namespace and etics are being served on port 8181)
You should see a dashboard similar to the following: