...
| Code Block | ||||
|---|---|---|---|---|
| ||||
        - name: KC_METRICS_ENABLED
value: "true" |
Prometheus
The metrics can then be scraped by Prometheus, just add an entry for it in the scrape_configs section:
| Code Block | ||||
|---|---|---|---|---|
| ||||
    scrape_configs:
    - job_name: keycloak
      scrape_interval: 10s
      metrics_path: /metrics
      static_configs:
      - targets:
- keycloak.default:8080 |
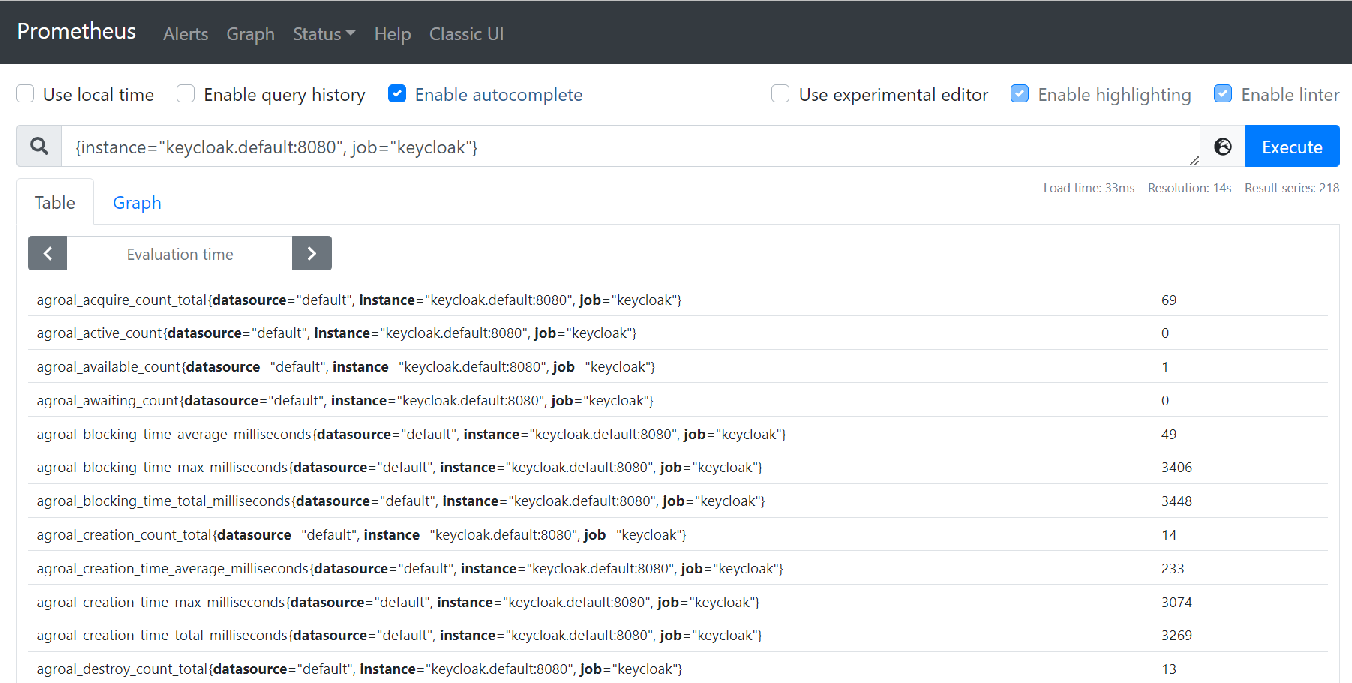
You can query all the keycloak metrics using: {instance="keycloak.default:8080", job="keycloak"}
Grafana
The metrics can then be viewed in Grafana:
...