| Table of Contents |
|---|
Introduction
Prometheus
Prometheus can be used to collect monitoring data from Kafka.
...
| Code Block | ||||
|---|---|---|---|---|
| ||||
    scrape_configs:
    - job_name: prometheus
      static_configs:
      - targets:
        - localhost:9090
    - job_name: kafka-exporter
      scrape_interval: 10s
      metrics_path: /metrics
      static_configs:
      - targets:
- kafka-exporter.kafka:9100 |
Grafana
You can then setup the grafana dashboard to view your metrics : kafka-exporter-overview_rev5.json
...
Note: It is also possible to obtain JMX metrics using jolokia (GitHub - paksu/kafka-jolokia-telegraf-collector: Simple Kafka broker JMX metric collection with Telegraf) but this requires creating a custom a custom kafka cluster image if you are using Strimzi.
InfluxDB
To store these metrics in InfluxDB you need to do is setup up a bucket and a metrics scraper for the kafka-exporter metrics endpoint.
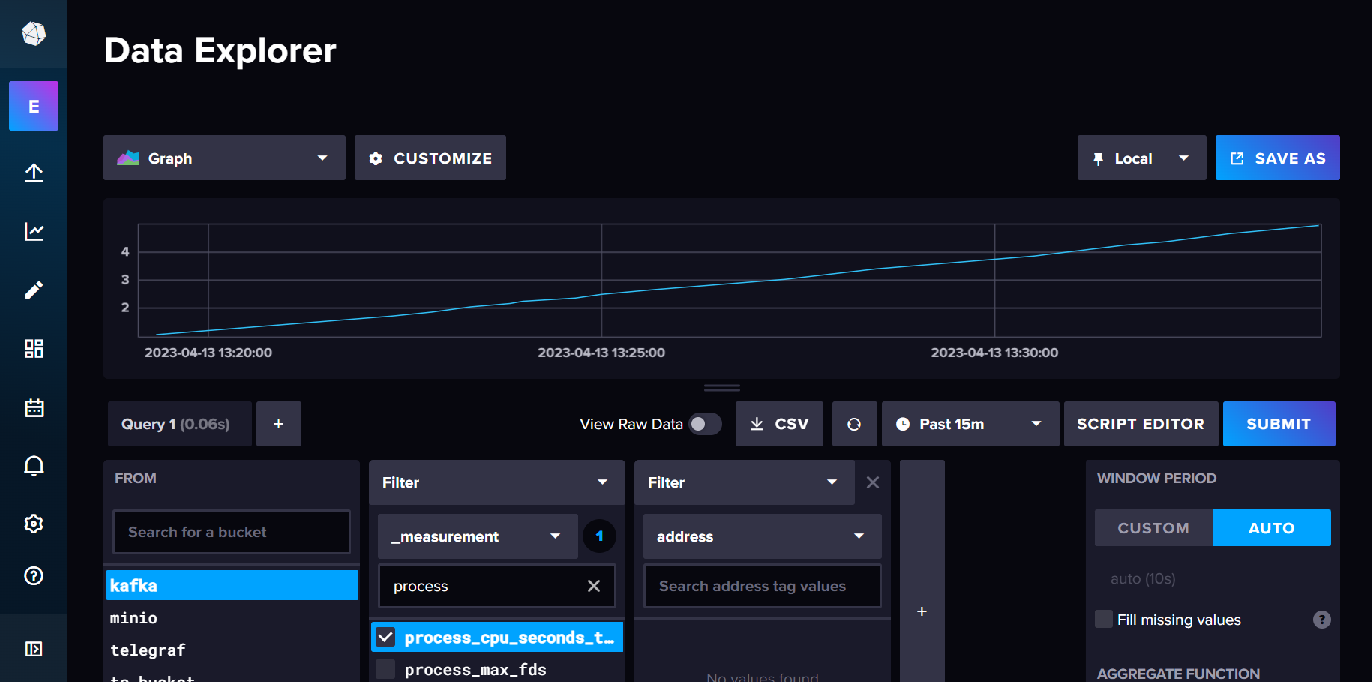
You can then view the metrics in data explorer.
Links
Grafana Dashboard for Kafka Exporter
...