...
This is the default option, a secret is generated automatically when the client is created.
x509 Certificate
This is requires setting up an authentication flow for the client and then setting the "Direct Grant Flow" to this new flow in the "Authentication flow overrides" section of the client configuration.
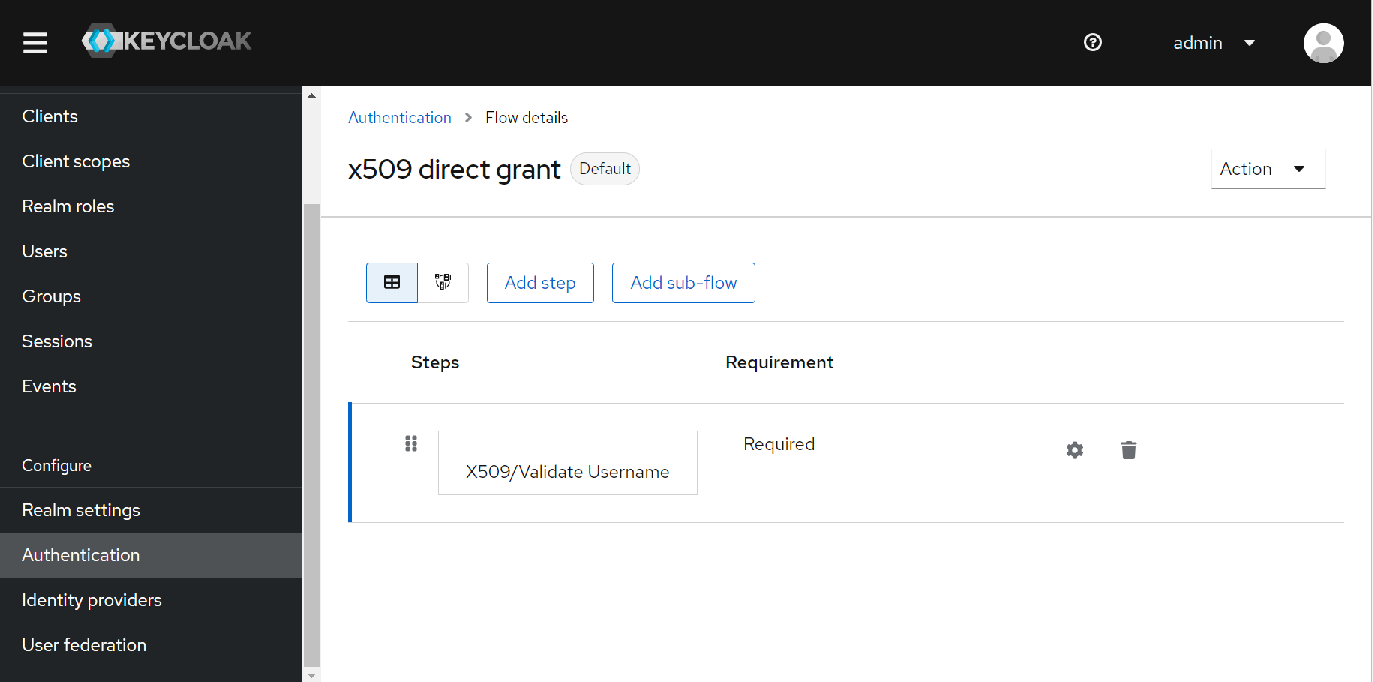
You can also enabled regexp pattern matching in the credentials section of the client if required.
When a token request is made with the x509 certificate, a part of the certificate like the subject's email is compared with the email from one of the users in the realm, if there is a match a token is issued.
...
The certificate is then compared with a JWK URI or a static JWKS (This can be created using the certificate and pubic key then imported into to keycloak).
If the signatures match, a token is issued.
JWT signed with secret
Similar to above except for JWT is signed with the client secret instead of a certificate.
Metrics
By including the following environment variable metrics will be available on the /metics endpoint
| Code Block | ||||
|---|---|---|---|---|
| ||||
        - name: KC_METRICS_ENABLED
value: "true" |
Prometheus
The metrics can then be scraped by Prometheus, just add an entry for it in the scrape_configs section:
| Code Block | ||||
|---|---|---|---|---|
| ||||
    scrape_configs:
    - job_name: keycloak
      scrape_interval: 10s
      metrics_path: /metrics
      static_configs:
      - targets:
- keycloak.default:8080 |
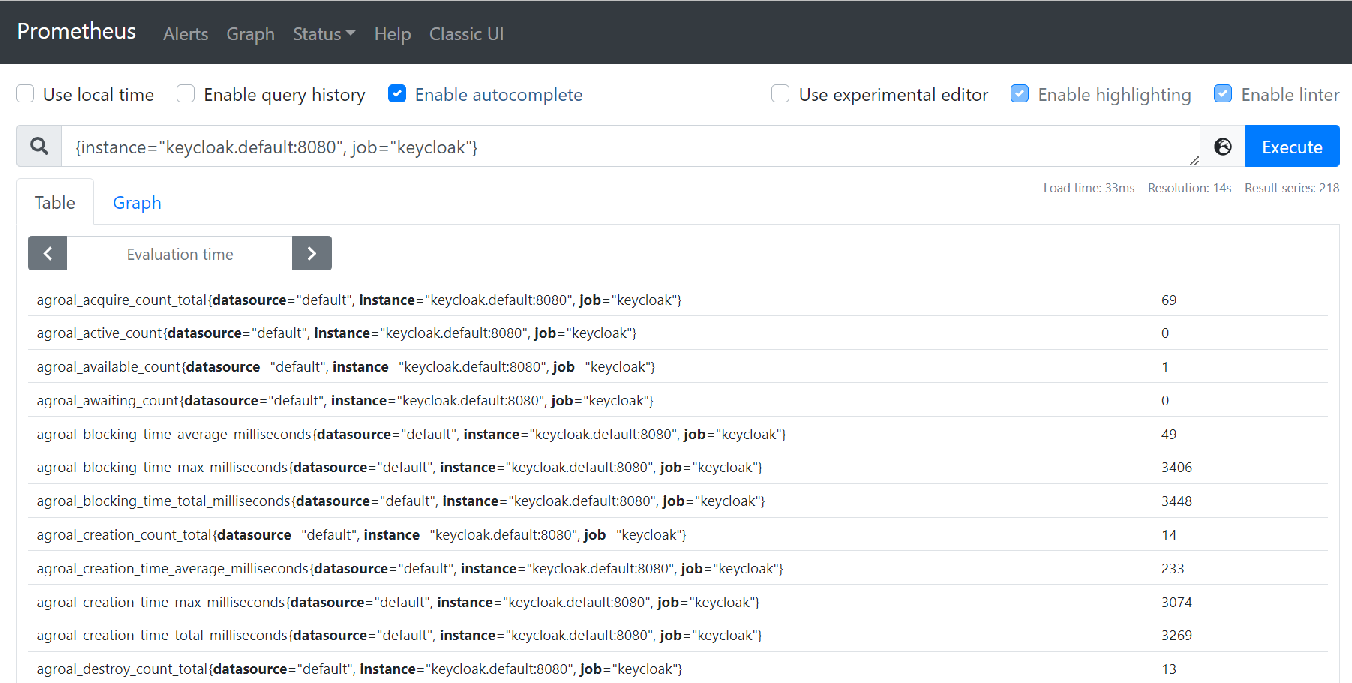
You can query all the keycloak metrics using: {instance="keycloak.default:8080", job="keycloak"}
Grafana
The metrics can then be viewed in Grafana:
...
This dashboard is available here: Keycloak Metrics Dashboard-1680702117153.json
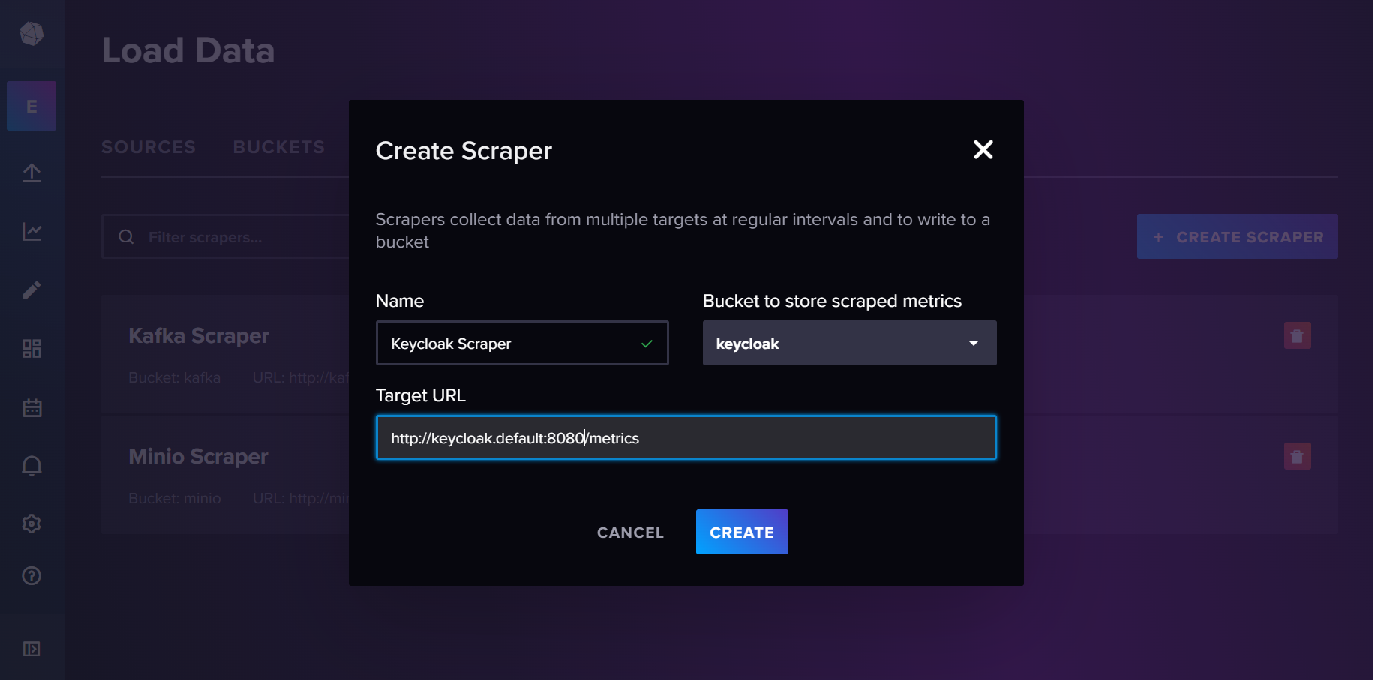
InfluxDB
These metrics can also be made available in InfluxDB by setting up a metrics scraper and a bucket to store the metrics.
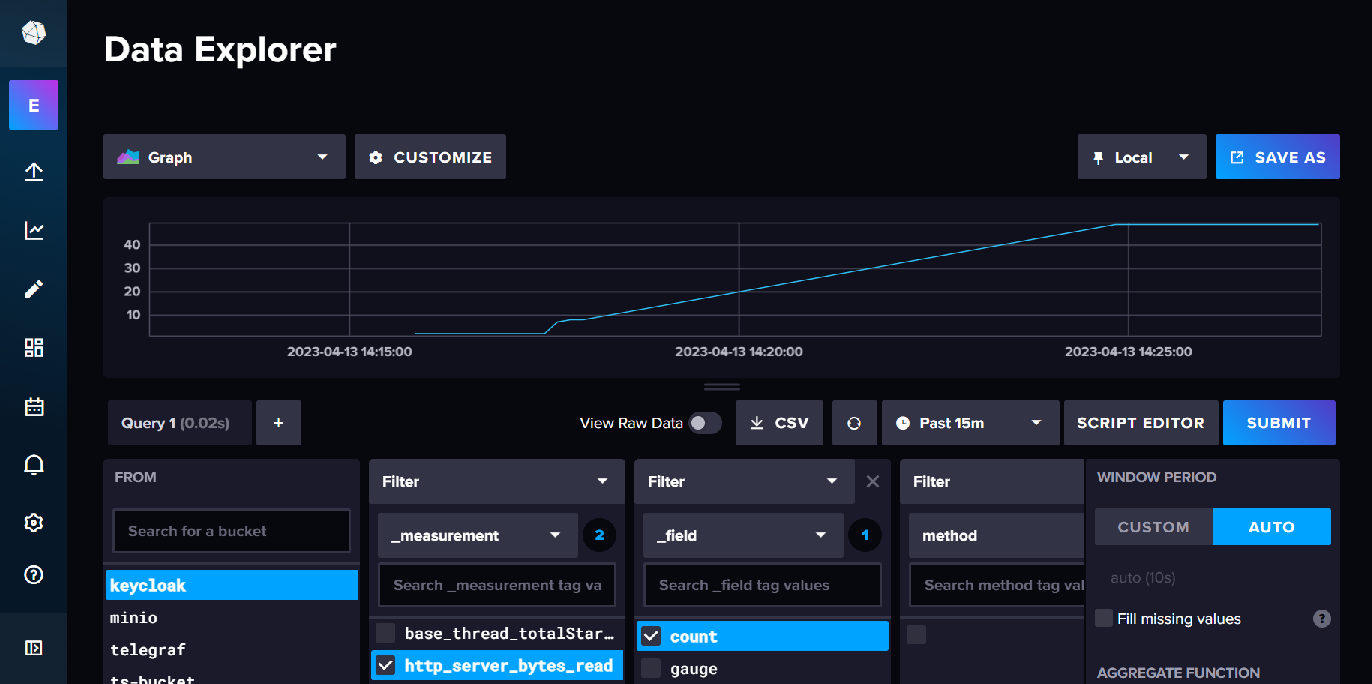
The metrics can then be viewed in data explorer.
LINKS
Running Keycloak in a container