...
| Code Block | ||||
|---|---|---|---|---|
| ||||
    scrape_configs:
    - job_name: prometheus
      static_configs:
      - targets:
        - localhost:9090
    - job_name: kafka-exporter
      scrape_interval: 10s
      metrics_path: /metrics
      static_configs:
      - targets:
- kafka-exporter.kafka:9100 |
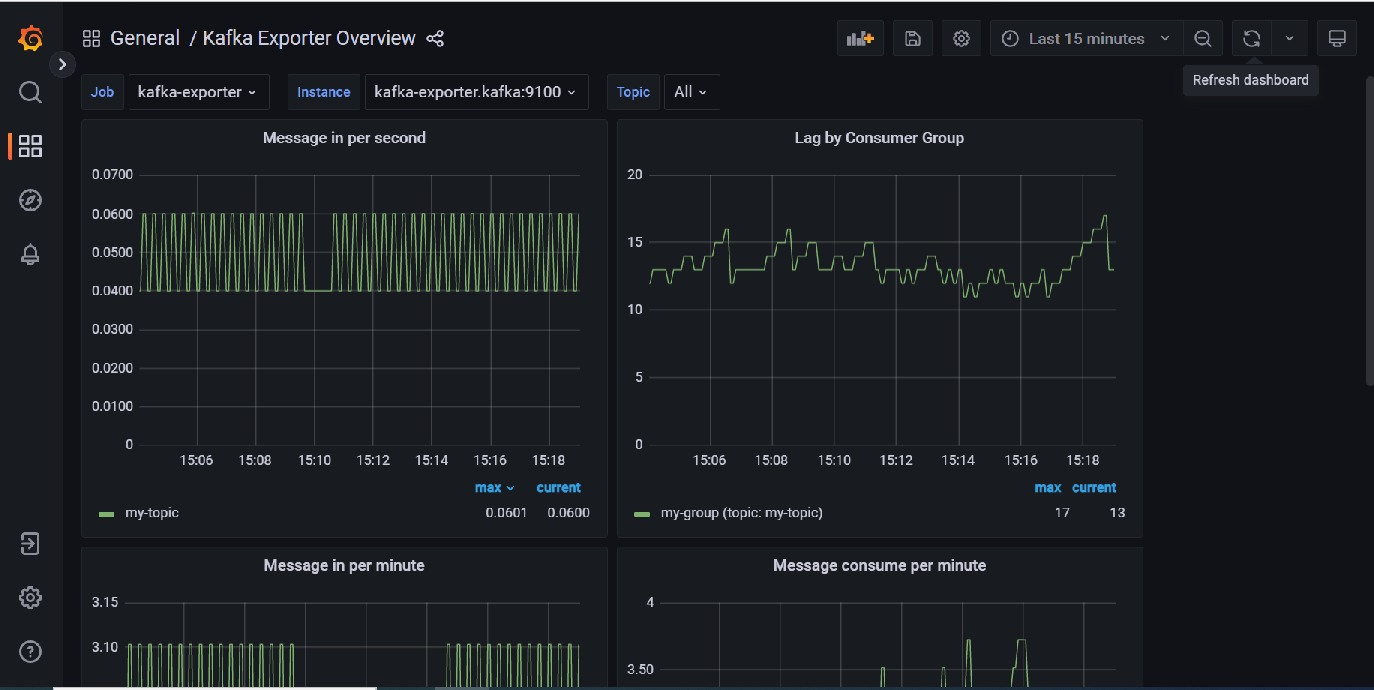
You can then setup the grafana dashboard to view your metrics : kafka-exporter-overview_rev5.json
These metrics can also be imported into telegraf by adding the following lines to your inputs:
| Code Block | ||||
|---|---|---|---|---|
| ||||
     [[inputs.prometheus]]
      urls = ["http://kafka-exporter.kafka:9100/metrics"]
response_timeout = "10s" |