High level architecture
Overview
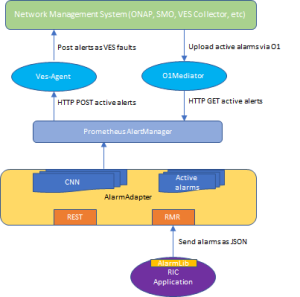
RIC alarm system implements two components: Alarm Adapter and application library interface
The AlarmAdapter is responsible for managing alarm situations in RIC cluster and interfacing with Northbound applications such as Prometheus AlertManager to post the alarms as alerts. AlertManager takes care of deduplicating, silencing and inhibition (suppressing) of alerts, and routing them to the VESAgent, which, in turn, takes care of converting alerts to faults and sending them to ONAP as VES events.
The Alarm Library provides a simple interface for RIC applications (both platform application and xApps) to raise, clear and re-raise. The Alarm Library interacts with the AlarmAdapter via RMR interface.
Alarm Adapter
TODO
Alarm Library
Initialization
A new alarm instance is created with InitAlarm()-function. ManagedObject (mo) and Application (ap) identities are given as a parameter
Alarm Context/Object
The Alarm object contains following parameters:
* SpecificProblem: problem that is the cause of the alarm
PerceivedSeverity: The severity of the alarm, see above for possible values
* ManagedObjectId: The name of the managed object that is the cause of the fault
* ApplicationId: The name of the process raised the alarm
AdditionalInfo: Additional information given by the application
* IdentifyingInfo: Identifying additional information, which is part of alarm identity
Ietms marked with ![]() , i.e., ManagedObjectId (mo), SpecificProblem (sp), ApplicationId (ap) and IdentifyingInfo (IdentifyingInfo) make up the identity of the alarm. All parameters must be according to the alarm definition, i.e. all mandatory parameters should be present, and parameters should have correct value type or be from some predefined range. Addressing the same alarm instance in a clear() or reraise() call is done by making sure that all four values are the same is in the original raise() / reraise() call.
, i.e., ManagedObjectId (mo), SpecificProblem (sp), ApplicationId (ap) and IdentifyingInfo (IdentifyingInfo) make up the identity of the alarm. All parameters must be according to the alarm definition, i.e. all mandatory parameters should be present, and parameters should have correct value type or be from some predefined range. Addressing the same alarm instance in a clear() or reraise() call is done by making sure that all four values are the same is in the original raise() / reraise() call.
Alarm APIs
Raise: Raises the alarm instance given as a parameter
Clear: Clears the alarm instance given as a parameter, if it the alarm active
Reraise: Attempts to re-raise the alarm instance given as a parameter
ClearAll: Clears all alarms matching moId and appId given as parameters
Example on how to use the API
```go
package main

import (
    alarm "gerrit.o-ran-sc.org/r/ric-plt/alarm-go/alarm"
)

func main() {
    // Initialize the alarm component
    alarmer, err := alarm.InitAlarm("my-pod", "my-app")

    // Create a new Alarm object (SP=8004, etc)
    alarm := alarmer.NewAlarm(8004, alarm.SeverityMajor, "NetworkDown", "eth0")

    // Raise an alarm (SP=8004, etc)
    err := alarmer.Raise(alarm)

    // Clear an alarm (SP=8004)
    err := alarmer.Clear(alarm)

    // Re-raise an alarm (SP=8004)
    err := alarmer.Reraise(alarm)

    // Clear all alarms raised by the application - discussion ongoing if to be deprecated.
    err := alarmer.ClearAll()
}
```
Example VES event
INFO[2020-06-08T07:50:10Z]
{
  "event": {
    "commonEventHeader": {
      "domain": "fault",
      "eventId": "fault0000000001",
      "eventName": "Fault_ricp_E2 CONNECTIVITY LOST TO G-NODEB",
      "lastEpochMicrosec": 1591602610944553,
      "nfNamingCode": "ricp",
      "priority": "Medium",
      "reportingEntityId": "035EEB88-7BA2-4C23-A349-3B6696F0E2C4",
      "reportingEntityName": "Vespa",
      "sequence": 1,
      "sourceName": "RIC",
      "startEpochMicrosec": 1591602610944553,
      "version": 3
    },

    "faultFields": {
      "alarmCondition": "E2 CONNECTIVITY LOST TO G-NODEB",
      "eventSeverity": "MAJOR",
      "eventSourceType": "virtualMachine",
      "faultFieldsVersion": 2,
      "specificProblem": "eth12",
      "vfStatus": "Active"
    }
  }
}
INFO[2020-06-08T07:50:10Z] Schema validation succeeded
Additional information
The README.md file in the ric-plt/alarm-go repository contains additional information about the alarm system.
34 Comments
RAGHU KOTA
Hi,
How does VES agent knows about configuration of VES collector?
Abukar Mohamed
Hi,
The hostname/IP address and port number of VES Collector is passed to VES Agent either as a startup parameter or via Configmap.
RAGHU KOTA
I see the below config parameter available in VESMGR, can you please point me which parameter needs to be filled for VES collecter addr?
VESMGR_PRICOLLECTOR_ADDR=aux-entry <<< Is this is the ves collector address?
VESMGR_PRICOLLECTOR_PORT=8443
VESMGR_PRICOLLECTOR_SERVERROOT=/vescollector <<< Can i know what is this?
Abukar Mohamed
Hi,
Yes, use VESMGR_PRICOLLECTOR_ADDR to specify the VESCollector hostname or IP address.
VESMGR_PRICOLLECTOR_SERVERROOT can be used to specify the root path of the VESCollector. Leave it empty, if server doesn't have root path.
RAGHU KOTA
Thanks i am able to configure. Now i am trying to test end to end and can i know do we have any VES Collector simulator for the same?
RAGHU KOTA
For testing purpose do we have any VES collector simulator?
Abukar Mohamed
Yes, here is the link to the VESCollector simulator: https://github.com/nokia/ONAP-VESPA/tree/master/ves-simu
RAGHU KOTA
I was trying to clear a alarm and observe how the VES event looks like. I see the VES event as below for cleared alarm.
Does it looks correct, also i am not able to figure out from VES event that this is a clear alarm event
{ "event": { "commonEventHeader": { "domain": "fault", "eventId": "fault0000000001", "eventName": "Fault_ricp_E2 CONNECTIVITY LOST TO E-NODEB", "lastEpochMicrosec": 1630681725452103, "nfNamingCode": "ricp", "priority": "High", "reportingEntityId": "D703291B-8EE8-4F91-AE1C-E7BC6CE72EE9", "reportingEntityName": "Vespa", "sequence": 1, "sourceName": "RIC", "startEpochMicrosec": 1630681725452103, "version": 3 }, "faultFields": { "alarmCondition": "E2 CONNECTIVITY LOST TO E-NODEB", "eventSeverity": "CRITICAL", "eventSourceType": "virtualMachine", "faultFieldsVersion": 2, "specificProblem": "INFO-1:-", "vfStatus": "Active" } } }"event": { "commonEventHeader": { "domain": "fault", "eventId": "fault0000000001", "eventName": "Fault_ricp_", "lastEpochMicrosec": 1630681905449912, "nfNamingCode": "ricp", "priority": "High", "reportingEntityId": "D703291B-8EE8-4F91-AE1C-E7BC6CE72EE9", "reportingEntityName": "Vespa", "sequence": 2, "sourceName": "RIC", "startEpochMicrosec": 1630681725452103, "version": 3 }, "faultFields": { "alarmCondition": "", "eventSeverity": "NORMAL", "eventSourceType": "virtualMachine", "faultFieldsVersion": 2, "specificProblem": "", "vfStatus": "Active" } } }Preethika Prathaban
Hi all,
Am trying to experiment VES. On vesamgr pod (Near RT RIC-dawn) have observed the following logs,
{"ts":1631687391299,"crit":"INFO","id":"vespamgr","mdc":{"CONTAINER_NAME":"","HOST_NAME":"","PID":"1","POD_NAME":"","SERVICE_NAME":"","SYSTEM_NAME":"","time":"2021-09-15T06:29:51","vespamgr":"0.7.4:ad906f6"},"msg":"Application='vespamgr' is not ready yet, waiting ..."}
time="2021-09-15T06:29:53Z" level=debug msg="Posting event: &{EventHeader:{Domain:heartbeat EventID:heartbeat0000000059 EventName:heartbeat_ricp EventType: InternalHeaderFields:<nil> LastEpochMicrosec:1631687383323344 NfNamingCode:ricp NfcNamingCode: Priority:Normal ReportingEntityID:42BE6E58-E74E-4D5A-BFBA-85748D755578 ReportingEntityName:Vespa Sequence:0 SourceID: SourceName:Vespa StartEpochMicrosec:1631687383323344 Version:3} heartbeatFields:{AdditionalFields:[] HeartbeatFieldsVersion:1 HeartbeatInterval:60}}"
time="2021-09-15T06:29:53Z" level=debug msg="Validating request payload with schema before sending it"
time="2021-09-15T06:29:53Z" level=debug msg="Send POST to http://sample1@pod-ves-simulator:8443/eventListener/v5"
time="2021-09-15T06:29:53Z" level=error msg="Cannot post event: Post http://sample1:***@pod-ves-simulator:8443/eventListener/v5: dial tcp: lookup pod-ves-simulator on 10.96.0.10:53: server misbehaving"
time="2021-09-15T06:29:53Z" level=error msg="VES collector unreachable, switch."
time="2021-09-15T06:29:53Z" level=debug msg="No backup collector stay on primary."
time="2021-09-15T06:29:53Z" level=info msg="Starting metrics collection"
time="2021-09-15T06:29:53Z" level=debug msg="Prometheus query : E2T{POD_NAME='e2term',RICcontrol='Messages'}"
time="2021-09-15T06:29:53Z" level=error msg="Cannot trigger scheduler measurements: Get http://infra-cpro-server:80/api/v1/query_range?end=2021-09-15T06%3A29%3A53.373198812Z&query=E2T%7BPOD_NAME%3D%27e2term%27%2CRICcontrol%3D%27Messages%27%7D&start=2021-09-15T06%3A09%3A30Z&step=30.000: dial tcp: lookup infra-cpro-server on 10.96.0.10:53: server misbehaving"
Tried changing the configmap to point to vescollector IP, but doesn't seem to have effect in vesamgr pod.
Is there any other place where ves agent can be configured?
RAGHU KOTA
U have to configure the VESMGR Collector address in helm charts under ric-dep directory
please check the below files:
helm/vespamgr/templates/secret.yaml
helm/vespamgr/templates/vespa-config.yaml
Preethika Prathaban
Thanks for the direction,
I have updated the configmap "configmap-ricplt-vespamgr" for variable "VESMGR_PRICOLLECTOR_ADDR:" but the logs of vesamgr pod still tries to connect to a different one.
LOGS: time="2021-09-15T09:11:25Z" level=debug msg="Send POST to http://sample1@pod-ves-simulator:8443/eventListener/v5"
Similarly prometheus query is also fetched from different endpoint according to logs,
time="2021-09-15T09:13:05Z" level=debug msg="Prometheus query : E2T{POD_NAME='e2term',ResetACK='Messages'}"
time="2021-09-15T09:13:05Z" level=error msg="Cannot trigger scheduler measurements: Get http://infra-cpro-server:80/api/v1/query_range?end=2021-09-15T09%3A13%3A05.331463664Z&query=E2T%7BPOD_NAME%3D%27e2term%27%2CResetACK%3D%27Messages%27%7D&start=2021-09-15T08%3A13%3A00Z&step=30.000: dial tcp: lookup infra-cpro-server on 10.96.0.10:53: server misbehaving"
Note:
configmap-ricplt-vespamgr data for reference:
VESMGR_PROMETHEUS_ADDR: http://r4-infrastructure-prometheus-server.ricplt
VESMGR_PRICOLLECTOR_ADDR: <ves-collector-ip>
RAGHU KOTA
update "vespamgr/config/config-file.json" in vespamanager directory and compile it.
- "prometheusAddr": "http://infra-cpro-server:80",
+ "prometheusAddr": "http://r4-infrastructure-prometheus-server.ricplt:80",
"alertManagerBindAddr": ":9095"
},
"collector": {
- "primaryAddr": "pod-ves-simulator",
- "secondaryAddr": "pod-ves-simulator",
+ "primaryAddr": "10.62.45.55",
+ "secondaryAddr": "10.62.45.55",
"serverRoot": "",
- "primaryPort": 8443,
- "primaryUser": "sample1",
- "primaryPassword": "sample1",
+ "primaryPort": 9999,
+ "primaryUser": "user",
+ "primaryPassword": "password",
"secure": false
}
},
Preethika Prathaban
Compile meaning building new docker image by cloning vespamgr, or can it be changed within pod runtime.
RAGHU KOTA
New Docker images by cloning vespamgr.
Preethika Prathaban
Thanks, let me try.
Then does this mean that application is not actively updating data from configmap and secrets.
Preethika Prathaban
Hi, Compiling code with config works.
Resolved prometheus endpoint issue.
However event to VES COllector is stilling failing.
LOGS:
time="2021-09-15T12:48:00Z" level=debug msg="Validating request payload with schema before sending it"
time="2021-09-15T12:48:00Z" level=debug msg="Send POST to http://sample1@192.168.61.146:8443/eventListener/v5"
time="2021-09-15T12:48:00Z" level=error msg="Cannot post event: HTTP request failed (status 400)"
On independently checking the VES collector its using v7, vespamgr uses v5 any idea how this can be sorted
RAGHU KOTA
Can you try setting "VESMGR_PRICOLLECTOR_SERVERROOT: "/eventListener/v7/events" in "helm/vespamgr/templates/vespa-config.yaml"
Preethika Prathaban
Changed serverRoot and compiled.
Still facing error.
LOGS:
time="2021-09-16T04:26:20Z" level=debug msg="Send POST to http://sample1@192.168.61.146:8443/eventListener/v7/events/eventListener/v5"
time="2021-09-16T04:26:20Z" level=error msg="Cannot post event: HTTP request failed (status 400)"
The part fed as serverRoot is getting appended before /eventListener. Looks like the ves application uses a default path.
Any idea about this?
RAGHU KOTA
Alarm package is in go language. Is there a way i can use this package from the cpp code?.
I tried exporting the alarm package as explained in the below page but due to restriction of "The function signature must not include neither Go struct nor Go interface nor Go array nor variadic argument." i am not able to export it as a c library
https://medium.com/swlh/build-and-use-go-packages-as-c-libraries-889eb0c19838
Thoralf Czichy
From C++ you'd probably better off using the xapp framework for C++: https://gerrit.o-ran-sc.org/r/gitweb?p=ric-plt/xapp-frame-cpp.git;a=blob;f=src/alarm/alarm.hpp .
RAGHU KOTA
Thanks will try this out. But i am trying to raise alarm from "git clone "https://gerrit.o-ran-sc.org/r/ric-plt/e2" " code which is in c++.
Let me try adding this code base and try it out.
RAGHU KOTA
Tried with this cpp framework but getting below error at alarm manager. I am working with dawn release
{"log":"{\"ts\":1635341974855,\"crit\":\"INFO\",\"id\":\"alarm-manager\",\"mdc\":{\"CONTAINER_NAME\":\"\",\"HOST_NAME\":\"\",\"PID\":\"7\",\"POD_NAME\":\"\",\"SERVICE_NAME\":\"\",\"SYSTEM_NAME\":\"\",\"alarmManager\":\"0.5.9:\",\"time\":\"2021-10-27T13:39:34\"},\"msg\":\"Received JSON: { \\\"managedObjectId\\\": \\\"meid-abc\\\", \\\"applicationId\\\": \\\"e2-term\\\", \\\"specificProblem\\\": 8007, \\\"perceivedSeverity\\\": \\\"CRITICAL\\\", \\\"identifyingInfo\\\": \\\"E2 CONNECTIVITY LOST TO E-NODEB\\\", \\\"additionalInfo\\\": \\\"BIND SYSTEM CALL FAILED\\\", \\\"AlarmAction\\\": \\\"RAISE\\\", \\\"AlarmTime\\\": 1635341974000848 }\\u0000\"}\n","stream":"stdout","time":"2021-10-27T13:39:34.855616859Z"}
{"log":"{\"ts\":1635341974860,\"crit\":\"ERROR\",\"id\":\"alarm-manager\",\"mdc\":{\"CONTAINER_NAME\":\"\",\"HOST_NAME\":\"\",\"PID\":\"7\",\"POD_NAME\":\"\",\"SERVICE_NAME\":\"\",\"SYSTEM_NAME\":\"\",\"alarmManager\":\"0.5.9:\",\"time\":\"2021-10-27T13:39:34\"},\"msg\":\"json.Unmarshal failed: invalid character '\\\\x00' after top-level value\"}\n","stream":"stdout","time":"2021-10-27T13:39:34.860789353Z"}
Abukar Mohamed
Looks like the alarm object is not valid JSON. Try to generate alarm manually and compare the contents to see what is wrong
RAGHU KOTA
I have tried it and compared, when manually generated the json is as below
{\\\"managedObjectId\\\":\\\"RIC\\\",\\\"applicationId\\\":\\\"UEEC\\\",\\\"specificProblem\\\":8007,\\\"perceivedSeverity\\\":\\\"CRITICAL\\\",\\\"additionalInfo\\\":\\\"-\\\",\\\"identifyingInfo\\\":\\\"INFO-1\\\",\\\"AlarmAction\\\":\\\"RAISE\\\",\\\"AlarmTime\\\":1635323436457767548}\"}\n"
As can be seeing there are some extra characters "\\u000" when generated by cpp alarm framework. I debugged it and could not figure out which part of the code is adding the same.
FYI the generated JSON body as part of function "xapp::Alarm::build_alarm" is as below
{ \"managedObjectId\": \"meid-abc\", \"applicationId\": \"e2-term\", \"specificProblem\": 8007, \"perceivedSeverity\": \"CRITICAL\", \"identifyingInfo\": \"E2 CONNECTIVITY LOST TO E-NODEB\", \"additionalInfo\": \"BIND SYSTEM CALL FAILED\", \"AlarmAction\": \"RAISE\", \"AlarmTime\": 1635335001000341 }
Further debugging to figure out the same.
RAGHU KOTA
After further debugging the issue got resolved after below change
bool xapp::Alarm::Raise( ) {
int used;
used = build_alarm( ACT_RAISE, msg->Get_payload(), msg->Get_available_size() );
-msg->Wormhole_send( whid, RIC_ALARM, xapp::Message::NO_SUBID, used + 1, NULL );
+msg->Wormhole_send( whid, RIC_ALARM, xapp::Message::NO_SUBID, used, NULL );
}
RAGHU KOTA
I am using dawn release, in alarm manager log file i continues see the below logs. Is there way i can comment this log, i checked the code and was not able to figure it out.
{"log":"{\"ts\":1637834460429,\"crit\":\"INFO\",\"id\":\"alarm-manager\",\"mdc\":{\"CONTAINER_NAME\":\"\",\"HOST_NAME\":\"\",\"PID\":\"7\",\"POD_NAME\":\"\",\"SERVICE_NAME\":\"\",\"SYSTEM_NAME\":\"\",\"alarmManager\":\"0.5.9:\",\"time\":\"2021-11-25T10:01:00\"},\"msg\":\"Application='' is not ready yet, waiting ...\"}\n","stream":"stdout","time":"2021-11-25T10:01:00.429639114Z"}
ak47885395@yahoo.com.tw
Hi RAGHU KOTA
I also encountered the same issue.
Did you find the solution?
Thanks a lot!
Abukar Mohamed
This is just a harmless INFO log generated by xapp-framework ... you can set log level to ERROR if you don't want to see the log anymore.
Chandra Shekar Telagamaneni
Hi Team , we are trying to integrate ves collector simulator with vespamanager of ricplt.
we were able to access VES collector(simu) through rest api call directly
example:-(curl -X GET -v "http://localhost:8443/testControl/v5/stats")
but with vespamanager pod we are facing error as below logs:
{"ts":1650630386903,"crit":"INFO","id":"vespamgr","mdc":{"CONTAINER_NAME":"","HOST_NAME":"","PID":"1","POD_NAME":"","SERVICE_NAME":"","SYSTEM_NAME":"","time":"2022-04-22T12:26:26","vespamgr":"0.7.4:5a562c5"},"msg":"Application='vespamgr' is not ready yet, waiting ..."}
time="2022-04-22T12:26:29Z" level=debug msg="Posting event: &{EventHeader:{Domain:heartbeat EventID:heartbeat0000001353 EventName:heartbeat_ricp EventType: InternalHeaderFields:<nil> LastEpochMicrosec:1650630379643298 NfNamingCode:ricp NfcNamingCode: Priority:Normal ReportingEntityID:08dd0ad4-19a6-43b3-b9c1-35201fb12374 ReportingEntityName:Vespa Sequence:0 SourceID: SourceName:Vespa StartEpochMicrosec:1650630379643298 Version:3} heartbeatFields:{AdditionalFields:[] HeartbeatFieldsVersion:1 HeartbeatInterval:60}}"
time="2022-04-22T12:26:29Z" level=debug msg="Validating request payload with schema before sending it"
time="2022-04-22T12:26:29Z" level=debug msg="Send POST to http://foo@localhost:8443/eventListener/v5"
time="2022-04-22T12:26:29Z" level=error msg="Cannot post event: Post \"http://foo:***@localhost:8443/eventListener/v5\": dial tcp 127.0.0.1:8443: connect: connection refused"
time="2022-04-22T12:26:29Z" level=error msg="VES collector unreachable, switch."
time="2022-04-22T12:26:29Z" level=debug msg="No backup collector stay on primary."
time="2022-04-22T12:26:30Z" level=info msg="Starting metrics collection"
could you please suggest here?
and we are unable to find where the code written for default API call {http://usr:password@ip:port/eventListener/v5}
in vespamanager, In order to modify the version of API call V5 to V7 since ONAP ves collector uses V7.
could you please help where we can modify so that we can make use of it. when we will connect ONAP ves collector as well?
Thanks a lot
Chandra Shekar Telagamaneni
Hi Team,
after creating dummy alarm in alarm manager using cli.
./alarm-cli raise --moid RIC --apid UEEC --sp 8007 --severity CRITICAL --iinfo INFO-1 --host [alert manager IP] --port [ alert manager port] --if rmr
I see logs as below:-
log of Alarm Manager pod after creating alarm:
{"ts":1652100760739,"crit":"INFO","id":"alarm-manager","mdc":{"alarmManager":"0.5.9:2a5ec39","time":"2022-05-09T12:52:40"},"msg":"Posting alerts: labels: map[alertname:E2 CONNECTIVITY LOST TO E-NODEB service:RIC/UEEC severity:CRITICAL status:active system_name:RIC], annotations: map[additional_info:- alarm_id:3 description:INFO-1:- event_type:communication identifying_info:INFO-1 instructions:Not defined specific_problem:8007 timestamp:09/05/2022, 12:45:59]"}
log of Alert Manager :
level=error ts=2022-05-05T03:11:15.748Z caller=notify.go:372 component=dispatcher msg="Error on notify" err="Post http://service-ricplt-vespamgr-http:9095/alerts: context deadline exceeded" context_err="context deadline exceeded"
level=error ts=2022-05-05T03:11:15.749Z caller=dispatch.go:301 component=dispatcher msg="Notify for alerts failed" num_alerts=1 err="Post http://service-ricplt-vespamgr-http:9095/alerts: context deadline exceeded"
could you please help?
Thanks a lot
Thoralf Czichy
Is Vespamgr up-and-running? Alertmanager is trying to push alerts to Vespamgr and but it seems to be timing out for some reason. Maybe Vespamgr pod logs might have some hints …
Chandra Shekar Telagamaneni
Hi Thoralf Czichy, sorry for the delay
here we have logs of vespamgr pod :
time="2022-05-11T12:01:12Z" level=debug msg="Validating request payload with schema before sending it"
time="2022-05-11T12:01:12Z" level=debug msg="Send POST to http://foo@[ves-collector IP]:[ves-collector Port]/eventListener/v5"
time="2022-05-11T12:01:12Z" level=warning msg="Could not decode JSON response: invalid character 'S' looking for beginning of value"
time="2022-05-11T12:01:12Z" level=debug msg="Got response &{CommandList:[] RequestError:map[]}"
time="2022-05-11T12:01:12Z" level=debug msg="Post event succesfull."
time="2022-05-11T12:01:12Z" level=debug msg="state IncrementFaultSn for fault index 0000000001"
{"ts":1652270477239,"crit":"INFO","id":"vespamgr","mdc":{"CONTAINER_NAME":"","HOST_NAME":"","PID":"1","POD_NAME":"","SERVICE_NAME":"","SYSTEM_NAME":"","time":"2022-05-11T12:01:17","vespamgr":"0.7.4:5a562c5"},"msg":"Application='vespamgr' is not ready yet, waiting ..."}
could the highlighted log from above is responsible for "Error on notify" error log in alert manager? or the log in vespamgr <'vespamgr' is not ready yet, waiting>
could you please suggest here?
Thanks a lot
Rajesh Kumar
Hi All, As per above architecture , SMO can upload active alarms via O1. is this interface already implemented and if it is already implemented please provide some more details about the APIs how SMO uploads active alarms and how O1mediator connects with alert manager. Thanks
Thoralf Czichy
I understand O1 currently gives the list of E2 nodes (gnb/enb), list of active alarms, list of xapps and their health status (as per /o1/agent/pkg/nbi/nbi.go)
VES events for alarms are sent Vespa (see repo ric-plt/vespamgr), but as far as I understand these events are not fully standards-compliant.