Introduction
Minio metrics can be collected and displayed in a number of different ways.
Prometheus
Minio can be setup to work with Prometheus by adding the following environment variables to your minio deployment
        - name: MINIO_PROMETHEUS_AUTH_TYPE
          value: public
        - name: MINIO_PROMETHEUS_URL
          value: http://prometheus.istio-system:9090
        - name: MINIO_PROMETHEUS_JOB_ID
          value: minio-job
Setting MINIO_PROMETHEUS_AUTH_TYPE to 'public' means you can scrape these metrics without the need for a token in your scrape config.
You then need to setup a new job in Prometheus to scrape the Minio metric endpoint
    - job_name: minio-job
      metrics_path: /minio/v2/metrics/cluster
      scheme: http
      static_configs:
      - targets: ['minio.default:9000']
The job_name should match the MINIO_PROMETHEUS_JOB_ID from the previous step.
The metrics will now be available in Prometheus.
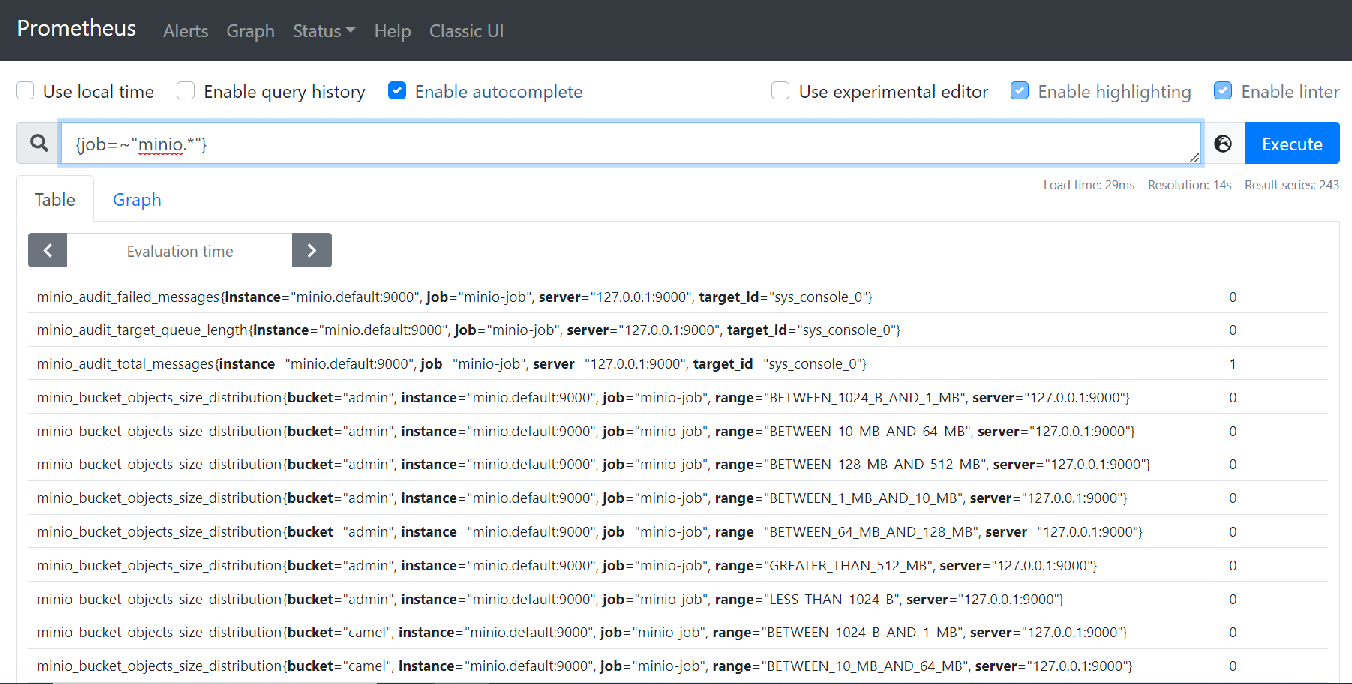
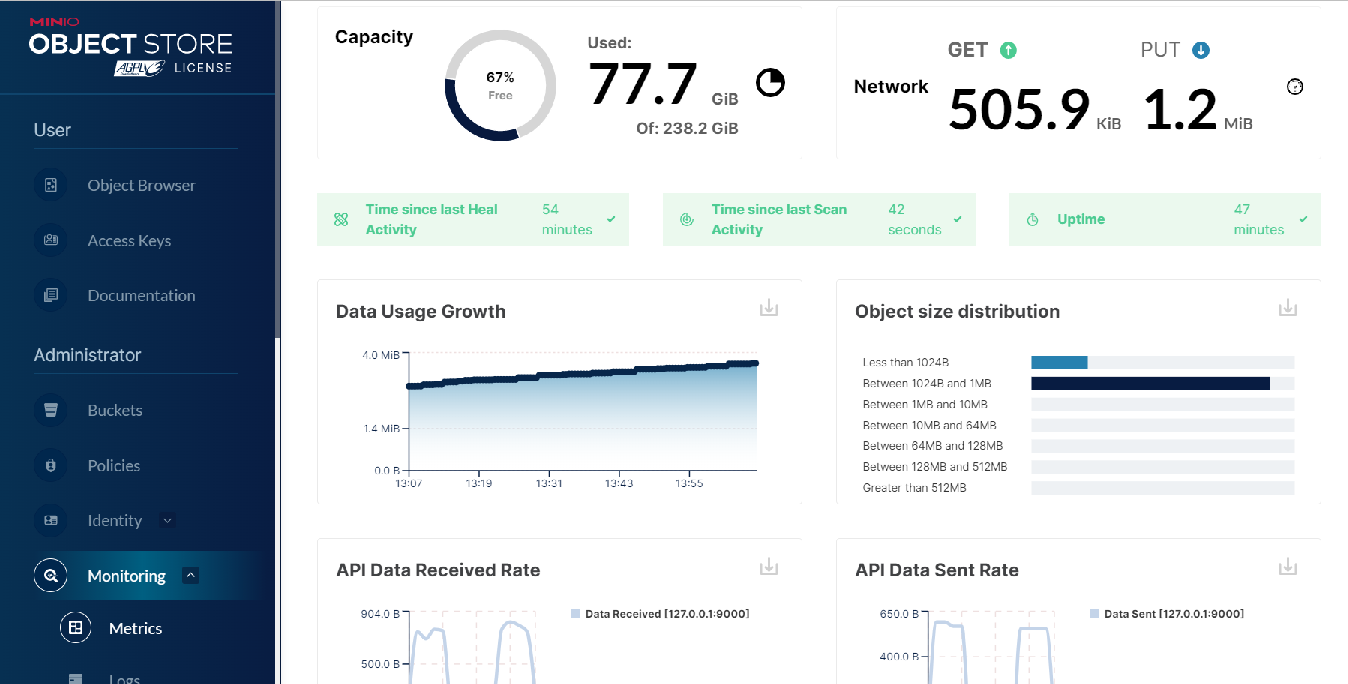
The metrics are also available in the minio console:
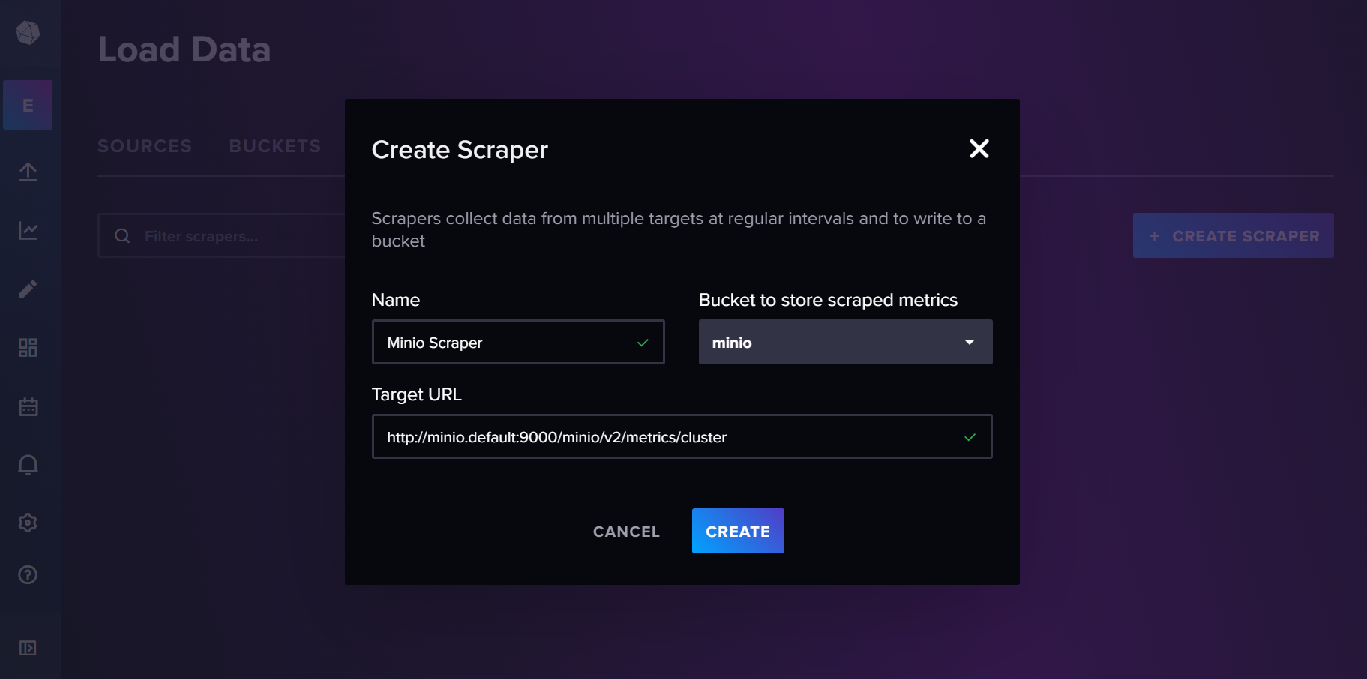
InfluxDB
These metrics can also be made available in InfluxDB by setting up a metrics scraper and a bucket to store the metrics.
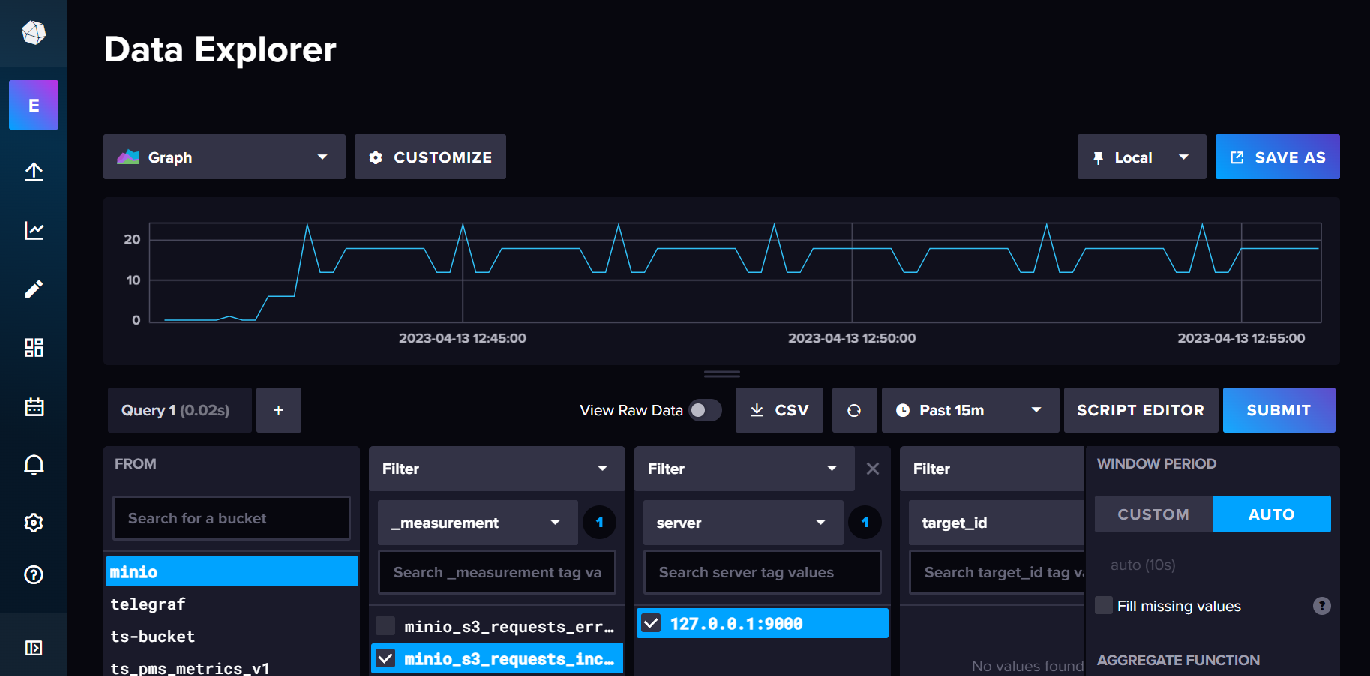
The metrics can then be viewed in data explorer
Links
Monitoring and Alerting using Prometheus
How to monitor MinIO server with Prometheus